

Multi-stream inference scaling on EXEC-Q911 (IQ-9075) across video resolutions
This topic describes a multi-stream inference benchmark on the EXEC-Q911 at 720p, 1080p, 2K, and 4K. The purpose is to observe how many channels the platform sustains in real time at each resolution, and what limits it as the channel count increases. The results are not intended to be a general hardware performance ranking.
- Application: iQS-QVADK v3.0.0 (GStreamer hardware decode → inference → drawing → compositor display)
- Task: object detection with an INT8 model
- Input: 720p, 1080p, 2K, and 4K, 30 FPS H.264 video streams
- Platform: EXEC-Q911 (Qualcomm Dragonwing IQ-9075), BSP v2.5.0
- Metrics:
- Output average end-to-end FPS per channel
- Average CPU loading (%)
- Average CPU memory usage (%)
- System power (W) and FPS per watt
Hardware
| Platform | EXEC-Q911 |
|---|---|
| SoM / SoC | Qualcomm Dragonwing IQ-9075 |
| Power plan | Normal |
| Processor cores | 8 |
| AI accelerator | NPU |
| AI runtime | TFLite 2.16.1 (QNN 2.47.0) |
| AI performance | 100 TOPS |
| Linux kernel | 6.18.30-01953-g5086fd78561b-dirty (PREEMPT) |
AI model
| Architecture | Numerical precision | Parameters | Input size | Model size | Model format | Dataset | Classes |
|---|---|---|---|---|---|---|---|
| YOLO26n | INT8 | 2.4 M | 640 × 640 | 2.60 MiB | TFLite | Innodisk PPE | 5 |
Videos
| File type | Resolution | Frame rate | Codec | Bitrate | File size | Length |
|---|---|---|---|---|---|---|
| MP4 | 720p | 30 FPS | H.264 | 15.8 Mbps | 56.4 MiB | 30 s |
| MP4 | 1080p | 30 FPS | H.264 | 15.8 Mbps | 56.4 MiB | 30 s |
| MP4 | 2K | 30 FPS | H.264 | 15.5 Mbps | 55.5 MiB | 30 s |
| MP4 | 4K | 30 FPS | H.264 | 15.4 Mbps | 55.2 MiB | 30 s |
The four videos were made from one licensed stock video from Envato, and they are not distributed with iQ-Studio. To reproduce the results, license a video and prepare your own copies at each resolution.
The four videos have almost the same bitrate, so only the resolution differs. This bitrate is higher than a typical 720p to 2K camera stream (about 2–8 Mbps), so the results show the load at equal bitrate and may not match a real camera deployment.
Results
Measurement summary
Each channel count was run once for 300 seconds with a 180-second warm-up. CPU and memory are averages over the 120 seconds after warm-up. Power is a single reading of the whole board at the power adapter.
| Resolution | Channels | CPU loading (%) | Average CPU memory (%) | Output average E2E FPS/channel | Power (W) | FPS/Watt |
|---|---|---|---|---|---|---|
| 720p | 1 | 16.5 | 5.3 | 29.99 | 10.1 | 2.97 |
| 720p | 4 | 39.0 | 7.8 | 29.99 | 13.0 | 9.23 |
| 720p | 6 | 44.2 | 8.9 | 29.99 | 15.8 | 11.39 |
| 720p | 8 | 54.0 | 10.2 | 29.99 | 18.3 | 13.11 |
| 720p | 9 | 57.1 | 10.8 | 29.99 | 19.0 | 14.21 |
| 720p | 12 | 66.3 | 11.7 | 29.98 | 20.9 | 17.21 |
| 720p | 16 | 75.3 | 14.2 | 29.98 | 23.2 | 20.68 |
| 1080p | 1 | 20.1 | 5.5 | 29.98 | 10.4 | 2.88 |
| 1080p | 4 | 44.0 | 8.1 | 29.99 | 14.9 | 8.05 |
| 1080p | 6 | 52.9 | 9.1 | 29.99 | 16.9 | 10.65 |
| 1080p | 8 | 63.7 | 11.1 | 29.98 | 20.2 | 11.87 |
| 1080p | 9 | 68.2 | 11.8 | 29.98 | 21.2 | 12.73 |
| 1080p | 12 | 84.6 | 13.9 | 29.97 | 23.9 | 15.05 |
| 1080p | 16 | 95.2 | 18.4 | 23.55 | 24.8 | 15.19 |
| 1080p | 24 | 94.9 | 24.2 | 15.54 | 25.3 | 14.74 |
| 2K | 1 | 20.8 | 5.7 | 29.98 | 10.8 | 2.78 |
| 2K | 4 | 45.4 | 9.2 | 29.99 | 16.4 | 7.31 |
| 2K | 6 | 59.1 | 11.2 | 29.98 | 23.1 | 7.79 |
| 2K | 8 | 76.5 | 13.3 | 29.98 | 22.8 | 10.52 |
| 2K | 9 | 87.2 | 14.8 | 29.97 | 24.5 | 11.01 |
| 2K | 12 | 97.8 | 19.1 | 21.75 | 25.1 | 10.40 |
| 2K | 16 | 97.7 | 23.3 | 16.59 | 25.2 | 10.53 |
| 4K | 1 | 22.5 | 6.5 | 29.98 | 11.7 | 2.56 |
| 4K | 4 | 56.4 | 11.8 | 29.98 | 20.7 | 5.79 |
| 4K | 6 | 99.1 | 16.6 | 23.30 | 24.6 | 5.68 |
| 4K | 8 | 99.6 | 20.3 | 13.97 | 24.8 | 4.51 |
FPS/Watt = (FPS per channel ÷ power) × channels. 4K stops at 8 channels (decoder limit). For channel counts that are not listed, see Known issues.
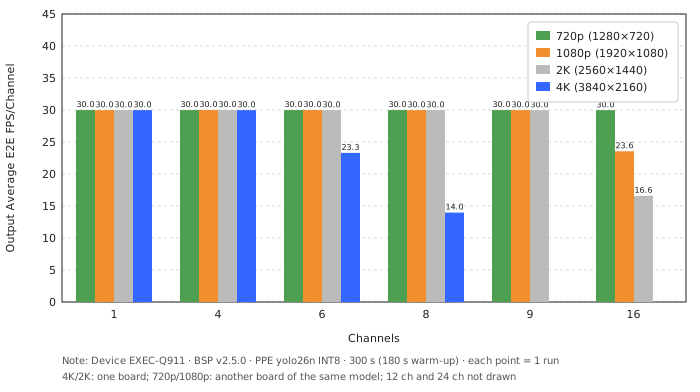
- The FPS plot (left) shows every resolution holding about 30 FPS per channel at low channel counts, then dropping once the CPU saturates: from 6 channels at 4K, 12 channels at 2K, and 16 channels at 1080p. 720p still holds 30 FPS at 16 channels.
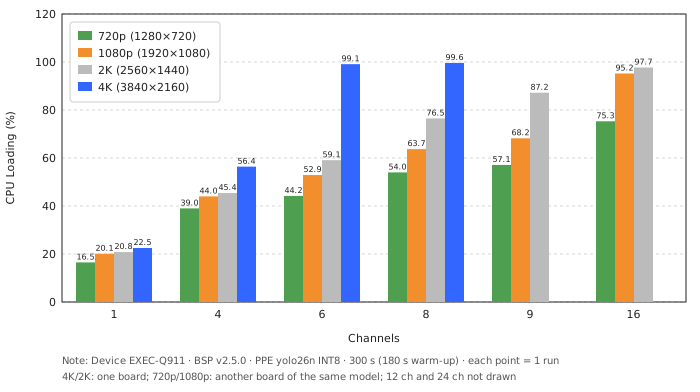
- The CPU loading plot (middle) shows the FPS drop lining up with CPU loading reaching about 95–99%. NPU utilization stayed below about 50% in every test (for example 4K 8 channels about 14%, 720p 16 channels about 48%), so the CPU, not the NPU, is the bottleneck.
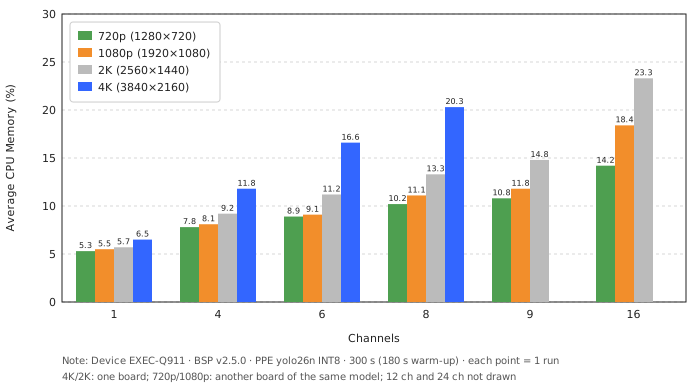
- The CPU memory plot (right) shows memory usage rising with channel count but staying moderate. It is the system-wide RAM usage, not NPU memory.
Conclusion
On EXEC-Q911 with this workload, near real-time FPS per channel is sustained up to 16 channels at 720p, 12 channels at 1080p, 9 channels at 2K, and 4 channels at 4K. Beyond that, the CPU saturates and per-channel FPS drops. Lower resolutions allow more channels, but the limit is not set by pixel count alone.
Notes
- Uptime: when the CPU is saturated, results get slower the longer the board has been up (about 11–20% lower after two hours, for example 1080p 16 channels: 22–24 FPS shortly after boot, about 19 FPS after two hours). Runs that are not CPU-limited are not affected. The cause is unknown, so record the uptime when comparing results.
- Boards: 4K and 2K were measured on one board and 720p and 1080p on another of the same model. Board-to-board variation was not measured.
- Single run: each point was run once, and power is a manual reading, so small differences are not meaningful.
Known issues
The following issues were observed with iQS-QVADK v3.0.0 on BSP v2.5.0.
- 720p at 24 and 32 channels and 1080p at 32 channels cannot run (NPU graph memory allocation fails).
- 1080p at 24 channels and 2K at 16 channels fail intermittently.
streampipecrashes once at the end of each run, after the report is printed. The results are not affected.
These issues are under investigation and will be re-tested after fixes.
How to Use
Below is an overview of how we conduct this benchmark on EXEC-Q911. The application runs in a Docker container.
- 1Install iQ-Studio
The iQS-QVADK Docker image is not included in the BSP. Pull it first:
- 2From the repository root on EXEC-Q911, change to the benchmark directory:
You should see
config.jsonin this directory:config.json is the config used in the next step.
iqs-launchershares the current directory with the container as/workspace, so the application reads it as/workspace/config.json. The default config runs 1 channel of the 1080p demo video in the image, so you can run the next step as it is. To change the video, the model, or the channel count, see How to change the config. - 3Run the benchmark for 300 seconds with a 180-second warm-up. Start it from an SSH session, because programs started from
adbor system services are limited to CPU cores 0–3, which lowers the results:The application prints the inference time and FPS report when it stops.
- 4Open a second SSH session. When the application has been running for 180 seconds, measure CPU and memory for 120 seconds. Run this from the directory where you ran
git clone: - 5(Optional) Around 250 seconds, read the power meter. The platform's power adapter is plugged into a digital power meter (DDSC-728), so the meter shows the power of the whole system.
How to change the config
Open config.json in benchmarks/iq-9075/multi-stream/iqs-qvadk-scaling/ and edit it:
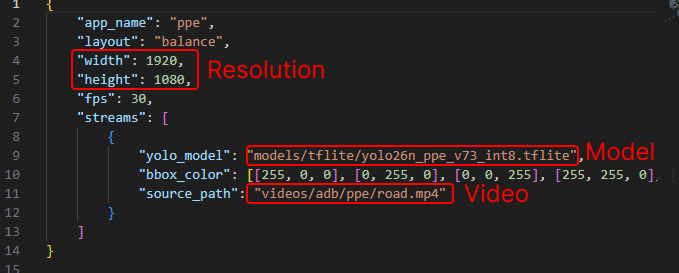
- Video: the default
source_pathisvideos/adb/ppe/road.mp4, the 1080p demo video in the image. To use your own video, first copy the file to thebenchmarks/iq-9075/multi-stream/iqs-qvadk-scaling/directory on the platform. For example, run this on your PC:Then set
source_pathto/workspace/<file name>, for example/workspace/01_720.mp4./workspaceis thebenchmarks/iq-9075/multi-stream/iqs-qvadk-scaling/directory as seen from inside the container, so the file must be in that directory. Also changewidthandheight(Resolution in the figure) to the resolution of the video:Resolution widthheight720p 1280 720 1080p (default) 1920 1080 2K 2560 1440 4K 3840 2160 - Model: the default
yolo_model(Model in the figure) ismodels/tflite/yolo26n_ppe_v73_int8.tflite, which is in the image. To use your own model, copy the file to thebenchmarks/iq-9075/multi-stream/iqs-qvadk-scaling/directory on the platform in the same way, and setyolo_modelto/workspace/<file name>. - Channel count: the
streamsarray has 1 entry (the{ ... }block in the figure), which is 1 channel. Copy the whole block and paste it after itself, separated by a comma, until the array has the channel count you want to test (for example 4, 8, or 16 entries). Every channel uses the same video.